When people compare countries for a move, "rule of law" and "corruption" usually come down to one number from the World Bank's Worldwide Governance Indicators (WGI). It draws on dozens of surveys and is easy to misread.
This guide covers what the indicators measure, the one rule that stops you over-reading them, and three worked examples from the 2026 release, which covers 1996 to 2025.
- Governance dimensions
- 6
- Cross-country data sources in the WGI dataset
- 35
- Economies covered
- 200+
- Confidence interval reported with every score
- 90%
What the six indicators measure
The WGI summarise six dimensions of governance for more than 200 economies. The 2026 methodology defines them as perceptions of:
- Voice and accountability: whether citizens can take part in choosing their government, and can hold it to account through information, oversight bodies and the media.
- Political stability: the likelihood of political instability, or of challenges to political authority through violent, coercive or unconstitutional means.
- Government effectiveness: the quality of public services, the civil service and policy delivery.
- Regulatory quality: the government's ability to make and enforce rules that let the private sector develop.
- Rule of law: how far people respect and follow the rules of society, "including contract enforcement, property rights, the police, courts, and the likelihood of crime and violence".
- Control of corruption: how far public power is used for private gain, from petty bribes to capture of the state by elites.
The key word is perceptions. The WGI draw on 35 sources, including household surveys such as the Gallup World Poll, firm surveys such as the World Bank's Enterprise Surveys, and expert assessments from groups such as the World Justice Project and Freedom House. A statistical model weights each source by how well it agrees with the others and combines them into one estimate per country, dimension and year.
Two numbers, and the one that matters for comparisons
Each country gets an estimate, on a scale centred near zero that typically runs from about -2.5 to 2.5. The current release, built on a methodology overhauled in 2025, also maps it to a score from 0 to 100, where 0 and 100 are a hypothetical worst-case and best-case country.
Each score comes with a 90% confidence interval. The interval is narrower when more sources cover a country and when they agree. The World Bank's documentation puts it this way:
A useful rule of thumb is that if the two confidence intervals overlap, the difference is not statistically, or likely practically, significant.
The same rule applies over time. The World Bank notes that most year-to-year movements are small relative to the margins of error, while changes over a decade can be real.
Earlier releases also reported a percentile rank, which is another 0 to 100 number. They are not interchangeable. A rank says where a country sits among the others; the score says where it sits between two fixed benchmarks. Before comparing two figures, check which one each source quotes.
Worked example 1: three countries that are effectively tied
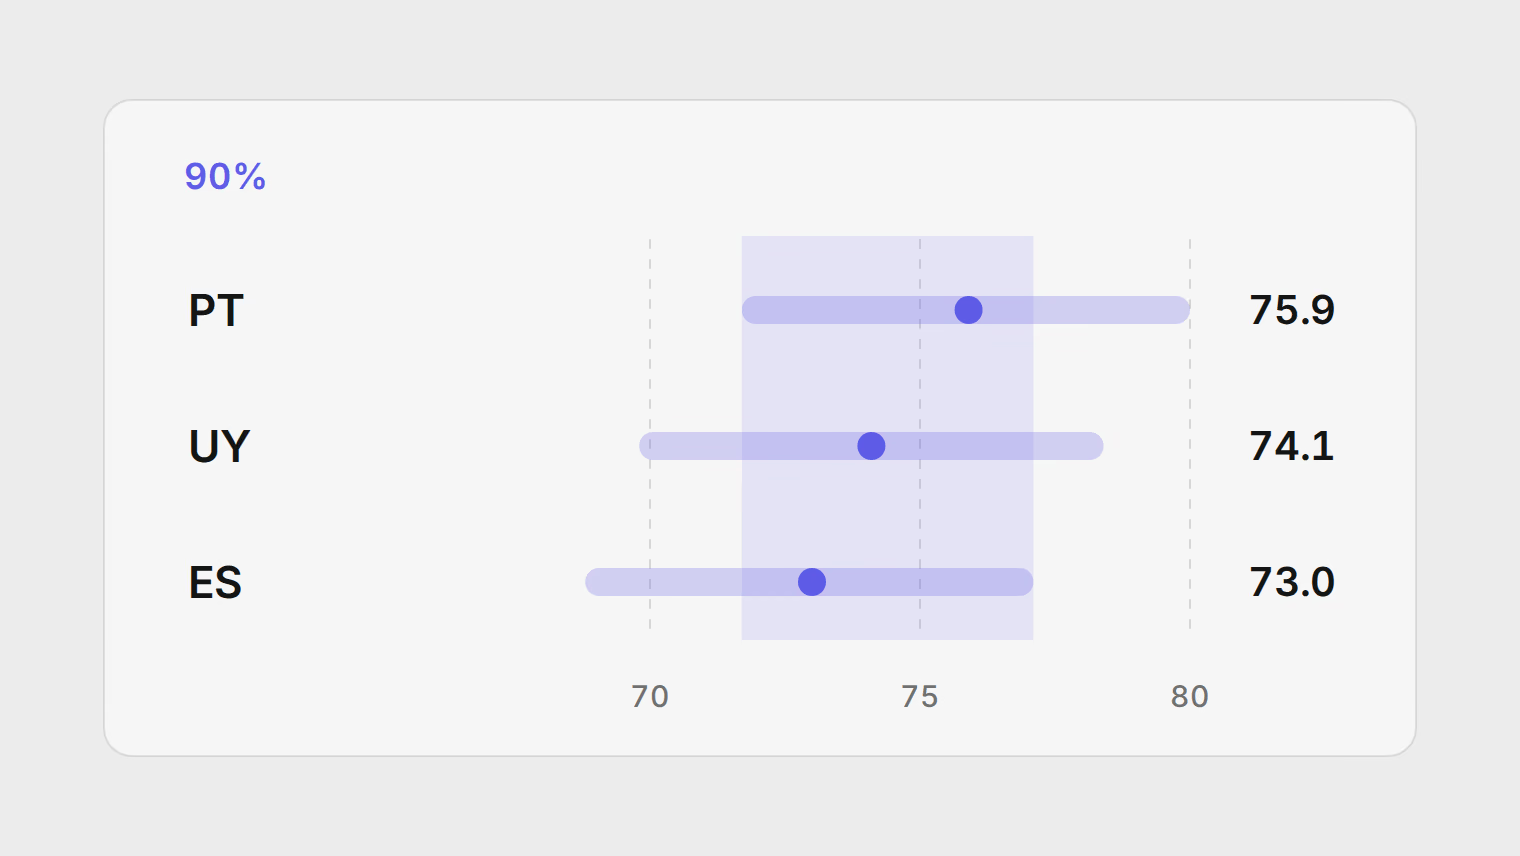
Here are the 2025 rule of law scores for Portugal, Uruguay and Spain:
| Country | Rule of law score | 90% interval | Sources |
|---|---|---|---|
| Portugal | 75.9 | 71.7 to 80.0 | 13 |
| Uruguay | 74.1 | 69.8 to 78.4 | 13 |
| Spain | 73.0 | 68.8 to 77.1 | 13 |
A ranking would put Portugal first and Spain third. The intervals tell you not to: they overlap almost completely, so the data cannot separate these three countries on rule of law.
Now the same three on control of corruption:
| Country | Control of corruption score | 90% interval | Sources |
|---|---|---|---|
| Uruguay | 79.4 | 73.8 to 85.1 | 10 |
| Portugal | 63.6 | 58.3 to 68.9 | 10 |
| Spain | 61.2 | 55.9 to 66.5 | 10 |
Here there is a gap. Uruguay's interval starts at 73.8, above where Portugal's and Spain's end. That difference is one the data supports. Portugal and Spain are still tied with each other.
The practical lesson: a table of scores invites you to read every row as a rank. Look for gaps that clear the intervals, and treat the rest as a tie.
Worked example 2: telling a trend from noise
Georgia's control of corruption score over ten years:
| Year | Score | 90% interval | Sources |
|---|---|---|---|
| 2015 | 63.3 | 57.7 to 68.9 | 12 |
| 2020 | 64.5 | 58.7 to 70.3 | 10 |
| 2024 | 56.2 | 50.3 to 62.1 | 9 |
| 2025 | 45.2 | 39.3 to 51.1 | 9 |
Two readings, both correct:
- The ten-year decline is real. The 2015 and 2025 intervals do not overlap.
- The one-year drop is not conclusive on its own. The fall from 2024 to 2025 is 11 points, but the intervals still overlap slightly (50.3 to 51.1), so by the World Bank's rule the single-year change alone is not significant. It continues a direction already visible since 2020.
Two other countries show long-run moves that clear the bar. Armenia's control of corruption score rose from 34.6 (28.6 to 40.6) in 2015 to 50.3 (43.9 to 56.7) in 2025. Mexico's rule of law score fell from 47.7 (43.7 to 51.7) to 39.4 (35.3 to 43.5) over the same period.
Notice the source counts, too. Georgia and Armenia are covered by 9 sources on corruption in 2025; Poland by 12. Fewer sources means wider intervals, so the same gap is less conclusive for a smaller country.
Worked example 3: the past changes with each release
Each WGI release re-estimates the whole history. The 2026 release says historical estimates were recalculated back to 1996, and that it supersedes previous releases.
Poland's rule of law estimate for 2024 shows what that means. In data downloaded from the World Bank on 30 June 2026, from the previous release, it was 0.577. In the September 2026 release, the same country and year read 0.543. Nothing happened in Poland; the model and its inputs were updated.
So never mix figures from different releases. If one source quotes Poland's 2024 score from last year's release and another quotes Czechia's from this year's, the comparison is not valid even if both are labelled "2024".
What the indicators are not for
The World Bank's usage advisory is explicit. Because the scores reflect perceptions, they "should be treated as estimates rather than definitive ratings". Perceptions can lag behind real reforms. The advisory says the WGI should not serve as definitive criteria for credit ratings, investment risk or other critical financial decisions.
For a move, that suggests a sensible way to use them:
- Use them to screen, not to rank. They are good at separating countries with strong institutions from countries with weak ones. They are poor at ordering countries in the same band.
- Read the interval, not the point. Two countries within a few points of each other are, for these purposes, the same.
- Look at ten years, not one. Direction over a decade is informative; a single year rarely is.
- Use one release. Download all your comparison countries from the same release.
- Go to the detail for decisions. For a specific worry, such as how long commercial disputes take, or how the police treat foreigners, read the underlying sources and country reports. The WGI documentation lists each source and its questions.
On the map, the rule of law lens is built on these indicators, and the safety, business and residence lenses use some of the others, such as political stability and regulatory quality. The methodology lists every input and weight.
Data: World Bank, Worldwide Governance Indicators, 2026 update (API, last updated 25 September 2026). Figures are governance scores (0 to 100) with 90% confidence intervals.