"Cheap country" lists usually rank cities by a handful of crowd-reported prices. There is an official number that answers a cleaner question: the World Bank's price level index.
All figures below are for 2025, from the World Bank's World Development Indicators as updated on 8 October 2026.
- Switzerland, the highest price level here (US = 100)
- 128.2
- Vietnam, the lowest price level here
- 28.9
- Türkiye: the same basket in dollars, 2022 to 2025
- +53%
- Latest surveyed benchmark year; later years are extrapolated
- 2021
Where the number comes from
The index divides two exchange rates. One is the market rate you see at a bank. The other is a purchasing power parity (PPP) rate: how many units of local currency buy what one dollar buys in the US, worked out by pricing comparable goods and services in each country.
price level index = PPP rate / market exchange rate × 100
The series used here, PA.NUS.PRVT.PLI, covers household final consumption: the goods and services households buy, including imputed items such as the rent owner-occupiers would pay themselves. The PPPs come from the International Comparison Program, a global price survey run in benchmark rounds. The latest round, for 2021, was published in May 2024. Later years are extrapolated from it rather than surveyed, so treat 2025 as a careful estimate, not a fresh measurement.
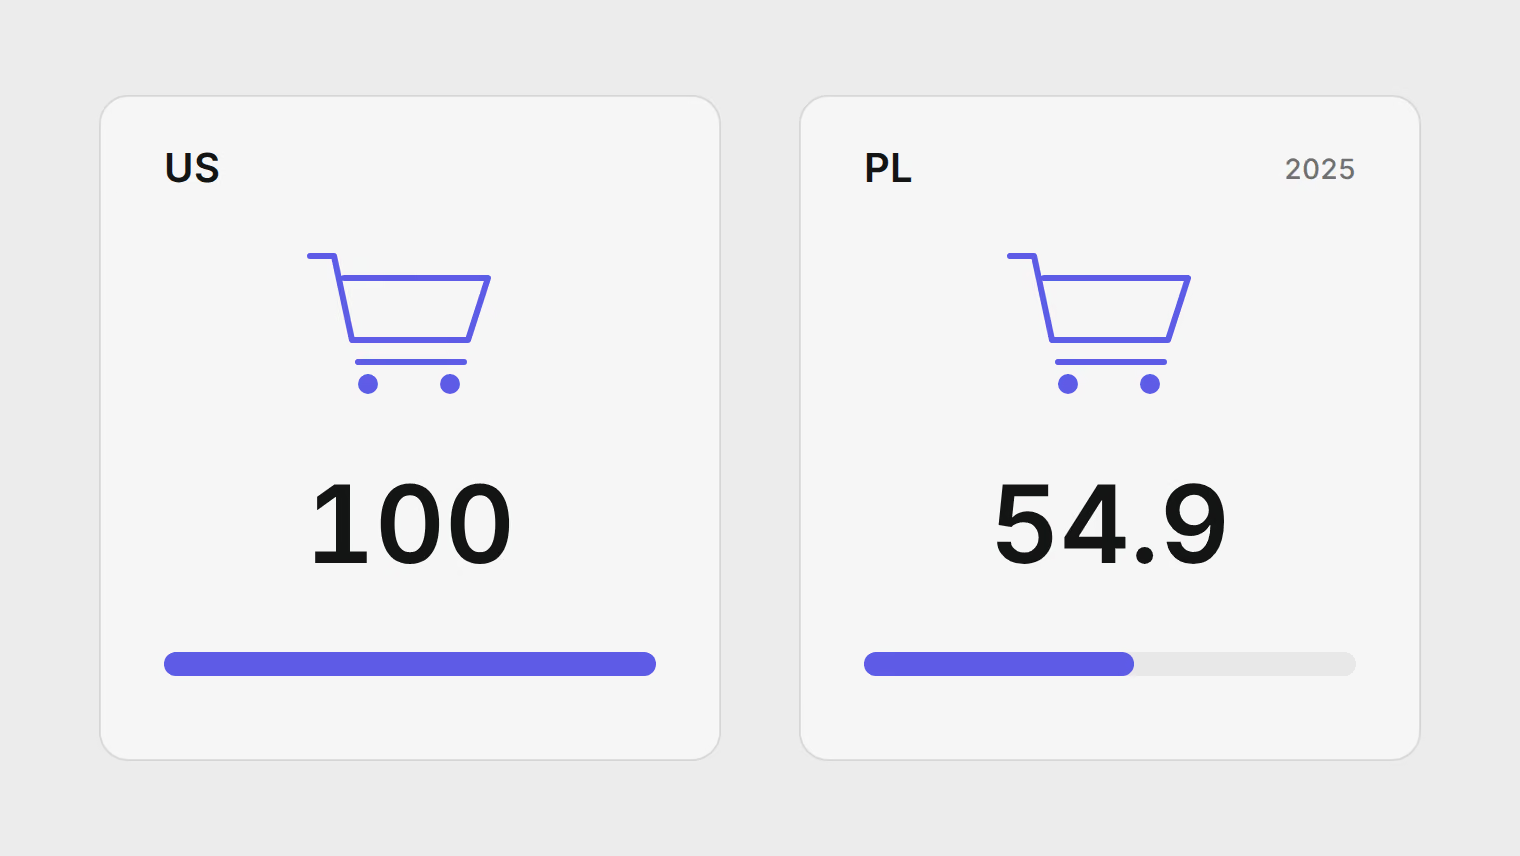
Check the arithmetic on Poland: its 2025 PPP rate was 2.06 zloty per dollar and the market rate averaged 3.76. That gives 2.06 / 3.76 × 100 = 54.9, the published value.
Worked example: one basket, eleven countries
Suppose your household spends 2,000 dollars a month in the US. Multiply by each country's index to see what the same pattern of spending would cost there, at 2025 exchange rates:
| Country | Price level (US = 100) | Same basket | GNI per person, PPP |
|---|---|---|---|
| Switzerland | 128.2 | $2,560 | $101,690 |
| Germany | 81.2 | $1,620 | $78,140 |
| Uruguay | 72.5 | $1,450 | $36,330 |
| Spain | 68.7 | $1,370 | $59,830 |
| Portugal | 64.9 | $1,300 | $52,240 |
| Mexico | 58.8 | $1,180 | $25,070 |
| Poland | 54.9 | $1,100 | $52,290 |
| Türkiye | 45.0 | $900 | $44,630 |
| Georgia | 39.7 | $790 | $27,570 |
| Thailand | 32.3 | $650 | $25,570 |
| Vietnam | 28.9 | $580 | $17,580 |
Source: World Bank, price level index and GNI per capita, PPP (NY.GNP.PCAP.PP.CD), 2025. Basket values rounded to the nearest 10 dollars.
Prices and incomes do not move together. Uruguay's price level is above Spain's and Portugal's and well above Poland's, even though Poland's income per person is far higher. Poland and Portugal have almost the same income per person in PPP terms, but the same basket costs about 15% less in Poland. Low incomes do not guarantee low prices. If you will earn a local salary, the right comparison is wages in PPP terms, which already adjust for prices. If you earn in dollars or euros from abroad, the price level is the number that matters.
Worked example: "cheap" is not a fixed property
The index moves with two things at once: local inflation and the exchange rate. When one runs ahead of the other, the dollar cost of living changes fast. Here is the same index for 2022 and 2025:
| Country | 2022 | 2025 | Change |
|---|---|---|---|
| Türkiye | 29.4 | 45.0 | +53% |
| Poland | 43.3 | 54.9 | +27% |
| Mexico | 54.7 | 58.8 | +7% |
| Uruguay | 68.7 | 72.5 | +5% |
| Georgia | 38.1 | 39.7 | +4% |
| Thailand | 32.8 | 32.3 | -2% |
Türkiye is the clearest case. Between 2022 and 2025 the lira fell from about 16.5 to 39.5 per dollar, a fall that on its own makes Turkish prices cheaper for a dollar earner. But local prices rose faster: the PPP rate went from 4.9 to 17.7 lira per dollar. Net effect for someone paid in dollars: the same basket cost 53% more in 2025 than in 2022.
Poland moved for the opposite reason. The zloty strengthened from 4.46 to 3.76 per dollar while prices rose, so dollar costs went up on both counts. Thailand barely changed.
If you are choosing a country partly because it is cheap, look at five years of this series, not one. A low number that is rising quickly is a different bet from a low number that has been flat.
Where the index misleads
The index is a national average of what an average household buys. Your spending may look nothing like that.
- Rent. The basket includes housing across the whole country, rural areas included, and much of it is imputed for owners. A one-bedroom flat in the capital can cost a far larger share of your budget than the index implies.
- Imported and international goods. Imported electronics, international schools and private health insurance tend to cost similar amounts everywhere. The cheaper a country's price level, the larger the share of your budget these items take.
- Categories differ. Eurostat's comparison of 2025 consumer price levels shows how wide the spread is inside Europe alone. Overall, Denmark was 40% above the EU average and Bulgaria 37% below. For energy, Germany was at 122% of the EU average and Hungary at 39%. A headline index hides that kind of variation.
- It is not a strict ranking or a price list. Eurostat's own guidance says price level indices are not intended to rank countries strictly; they give an order of magnitude, especially when countries sit close together. Spain at 68.7 and Portugal at 64.9 are in the same band. Published PPPs also describe product groups, not single products, so they cannot tell you what a coffee costs on a given street.
How to use it in a real budget
- Start with the index for orientation. Use it to rank a shortlist, not to set a budget.
- Check the trend. Five years of the series shows whether you are buying into a stable price level or a moving one.
- Price your own basket. Get real quotes for rent in the neighbourhood you would live in, health insurance, and schooling if you have children. These items move the budget most and the index captures them worst.
- Match the measure to your income. Paid from abroad: use the price level. Paid locally: compare salaries in PPP terms, or GNI per person in PPP as a rough proxy.
- Stress-test the currency. Ask what happens if your income currency falls 20% against the local one. Türkiye between 2022 and 2025 shows that the real-world swing can be larger.
The cost of living lens on the map uses this same price level series where the World Bank publishes it, rescaled so that a higher score means cheaper, and each country profile shows the year of the observation it uses. The methodology lists the other inputs and how they are weighted.